Search the portfolio

35 matches · showing 7

11 choices. A body of work. A web of ideas.

Skip to case study
Evelyna Bellamy
Auto · Daylight
Time of day

Following your local clock · Daylight

Warm ivory · charcoal · open sky

Local time, no location access. Choose a stop to keep that atmosphere.

Cartography / spatial change / human context

Cartologium

A place is more than a point.

A cartographic atlas connecting the geometry of maps with the histories, names, and changes that give a place meaning.

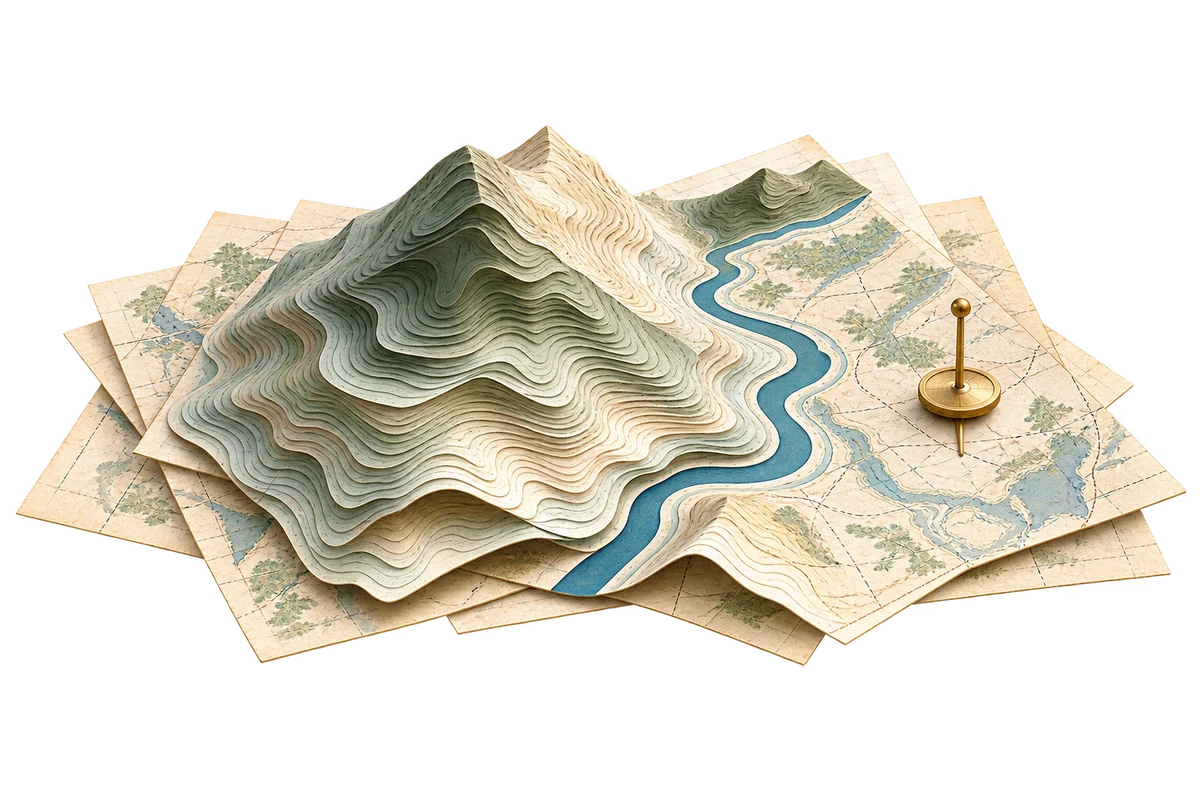
Contour-cut paper mountains rising around a blue river and a brass place marker

Maps are a way of asking
better questions.

Relief / A contour turns height into a line. Read the lines together and a landscape begins to emerge.

01 / The question

What does a map
choose to show?

A projection, a boundary, and a place-name each organize the world differently. Cartologium connects tools for inspecting those choices with dossiers about places and their histories. The design challenge is to move from a compelling view to a question the reader can investigate: what changed, what was preserved, and what does this representation leave out?

The place stays.
The perspective changes.

02 / Read beneath the surface

A place holds
more than one story.

Lift a layer. Follow what remains.

An exploded atlas of an imagined river valleyLandscape, Settlement, Connections shown on separated paper sheets. Every sheet uses the same geography.NSWE01 / The landRiverbendStone RidgeMarshland02 / The names03 / The crossing

A crossing changes the reading.

The river stays. New connections emerge.

Illustrative study · imagined place

Routes meet at the bridge. Bring the sheets together to see how the crossing connects the settlement to the land.

03 / From a world to a picture

Even the grid
makes a choice.

The projection workshop

Same place.
Different trade-offs.

A local adaptation of two analytical scale calculations from the project. Move the latitude to compare shape and area at the same location on a spherical Earth.

Equator · 0°75° North
01 / Conformal

Mercator

4.00×local area scale

The circle stays round. Its area grows away from the equator.

02 / Equal area

Gall–Peters

1.00×local area scale

Area stays constant. The circle changes shape.

Dashed circle: unit-scale reference. Colored ellipse: local scale in the east–west and north–south directions. Both plates use the same drawing scale.

Read the calculation

For latitude φ, Mercator uses h = k = 1 / cos(φ). Gall–Peters uses h = √2 cos(φ) and k = 1 / h. Local area scale is h × k.

These analytical spherical scale factors are adapted from Cartologium’s mathematical module. The ellipses visualize infinitesimal local distortion; they are not projected outlines of finite regions. The study stops at 75° to keep both diagrams legible.

Every projection makes a choice.

Evidence / Adapted calculation

Keep the location, change the representation

Decision Compare two projections at one latitude and one drawing scale so the difference in area and shape can be inspected directly.

Inspect the projection comparison
How to inspect: Keep the location, change the representation
  1. At 60° North, compare Mercator’s 4.00× local area scale with Gall–Peters’ 1.00×.
  2. Move the latitude to 0°. Mercator returns to 1.00×; Gall–Peters still preserves area while changing the shape.
  3. Open “Read the calculation” to inspect the scale factors, then reset the study.

Limit The ellipse is a local differential model. It does not represent a finite country, demonstrate historical impact, or measure a reader’s understanding.

04 / Design rationale

Trace. Compare.
Keep asking.

The interface becomes useful when it helps a reader move between the picture, the choices behind it, and the context beyond it.

Make the trade-off visible.

The projection study holds latitude and drawing scale constant across two views. Mercator preserves local angles; Gall–Peters preserves area. Showing both together lets the reader see the cost of each choice without remembering a previous screen.

Compare the projections

Let place connect the records.

Map DNA groups a place’s terrain, water, names, and history. The Palimpsest provides a second entrance through successive map epochs. These complementary reading paths connect a location to a longer story.

Explore the layers

Keep interpretation open to inspection.

A mapped boundary or changed label invites a historical question; it does not settle one. Links to the project’s dossiers let readers continue from the portfolio’s bounded demonstration into the supporting context.

Follow the sources

05 / Continue into the atlas

Follow a question
into the world.

The local studies are a point of entry. Continue into Cartologium to explore its instruments, place dossiers, and historical map layers.

Study notes & sources

The terrain portrait is an illustration. The working comparison models local distortion on a sphere, not an ellipsoidal survey or a complete map renderer. This study does not validate the atlas’s data-ingestion claims or report measured user outcomes.

The valley map is an illustration of an imagined place. Its overlaid names and routes demonstrate interface decisions, not historical change. No measured user or business outcomes are claimed.

Source context: Projection laboratory and dossiers ↗

There is always another layer.

A map is
a beginning.

Explore Cartologium

Look closer. Follow the river.